The heat arrives before the day has properly begun. It seeps through curtains and under doorframes, sliding across tiles and concrete like something alive. In the half-light of an Australian summer morning, the city already shimmers. Asphalt glows a dull, matte black. Air-conditioners hum like a distant swarm. On the horizon, a pale haze hangs over the suburbs, thickening with every passing hour. Somewhere beneath this slow-boiling sky, scientists are walking the streets with strange backpacks and car-mounted sensors, trying to map something most of us can feel, but barely see: the quiet spread of urban heat islands.
The City That Stays Hot After Dark
When Dr. Leila Morgan steps out of her lab in western Sydney at 9 p.m., she doesn’t need instruments to know it’s still hot. The car park radiates warmth like a cooling oven. She holds out her hand above the asphalt and laughs softly. “You can measure it with your skin,” she says.
In the paddocks 30 kilometres away, night is doing what night is supposed to do—relaxing the earth, dropping the temperature, giving plants and people a chance to reset. But here in the city, the heat lingers. Concrete, bricks, metal roofs, dark roads: all of them spent the day soaking up sunlight. Now they slowly leak it back out, hour after hour, turning streets into islands of warmth that refuse to cool.
This is the essence of an urban heat island: a place where the built environment traps and recycles heat so effectively that the city is noticeably warmer than its surrounding countryside. It’s not a new phenomenon—scientists in Europe were studying it more than a century ago—but in Australia, it’s becoming impossible to ignore. The heat waves are hotter. The nights are warmer. The suburbs are spreading farther and farther into once-open land, leaving a patchwork of microclimates stitched together by highways and rooftops.
For years, locals have described their experience with a shrug and a sentence: “The city’s always hotter.” Now, a growing network of researchers is turning that observation into high-resolution maps, numbers, and stories drawn from satellites, street sensors, and the lived experiences of Australians sweating through another long summer.
How Scientists Are Drawing Invisible Heat Maps
To map something as slippery as heat, scientists have had to get creative. It starts high above the continent, where satellites orbit quietly, their instruments tuned to recognise thermal radiation rising off the land. From space, Australia’s cities appear as bright splashes of warmth against cooler bushland and coastlines, especially at night.
But satellite images only tell part of the story. To understand what’s happening at street level—on the footpath outside your house, in the playground where your kids spend their afternoons—researchers drive slow loops through suburbs in modified cars, sensors strapped to roof racks. Others walk or cycle with compact devices slung over their shoulders, recording air temperature, humidity, and wind as they go.
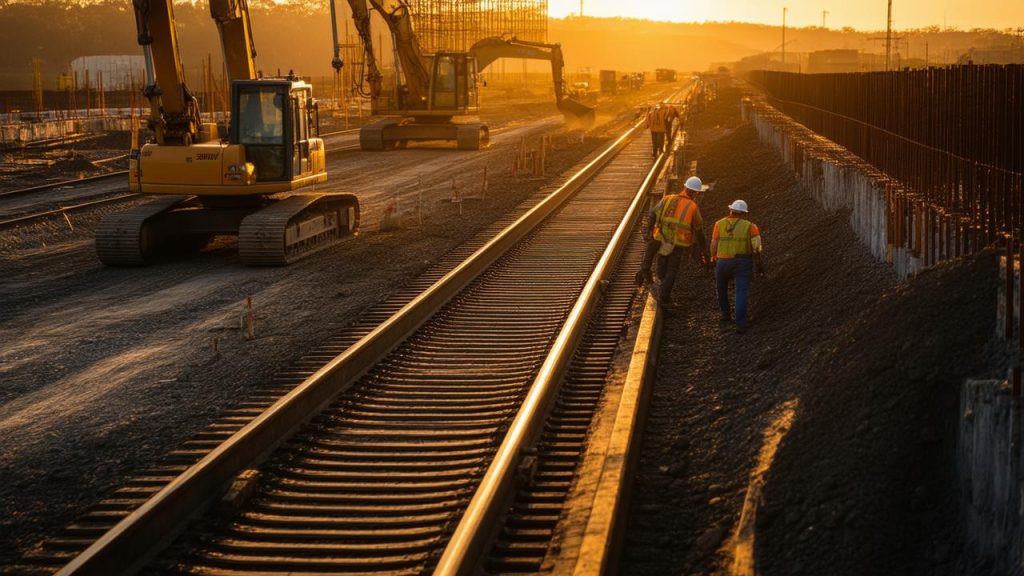
On a late January morning, a team trails through a Western Melbourne suburb. The air smells faintly of melting bitumen and eucalyptus. At every intersection, the sensor readings spike and dip unpredictably. A tree-lined street might be several degrees cooler than the main road it feeds into. A parking lot bordered by reflective glass buildings glows with stored heat, the kind you feel in your bones.
By the end of the day, the scientists are back indoors, the sunburn blossoming on their necks as they watch data unfold on screens. The pattern is shockingly clear: some pockets of the city are consistently, stubbornly hotter than others—by 3, 5, even 8 degrees Celsius. It’s not just a hot day. It’s an unevenly distributed one.
What the New Heat Maps Are Revealing
As these measurements accumulate across Sydney, Melbourne, Brisbane, Perth, Adelaide, Darwin and beyond, a national picture is emerging. It’s as if someone is lifting thermal glasses to our eyes and saying, “Look. This is what your city really feels like.”
Certain truths appears again and again:
- Neighbourhoods with more trees and parks are cooler, especially at night.
- Areas dominated by dark roofs, extensive asphalt, and large car parks heat up faster and stay hot longer.
- Low-lying suburbs with fewer breezes and less vegetation often bear the brunt of the heat.
- Older parts of cities, with dense housing and little space for greenery, can be particularly punishing during heatwaves.
Many of these patterns mirror existing social and economic lines. In several Australian cities, the hottest suburbs often overlap with places where incomes are lower, public transport is scarce, and rental housing is dense. Urban heat, it turns out, doesn’t land evenly. It follows planning decisions, historic neglect, and the quiet logic of where trees were planted—or not planted—decades ago.
Where Heat Hits Hardest
On the outskirts of Brisbane, residents in a relatively new housing estate talk about summer like it’s a siege. The houses are big and packed close together, roofs a patchwork of deep charcoal and bottle green metal. Many front yards are mostly driveway. The single saplings planted on nature strips barely throw a shadow.
“We can’t let the kids play outside after 10 a.m.,” one parent explains. “The playground equipment burns their hands. The slide gets so hot you can’t touch it.” On the hottest days, the air-conditioned shopping centre becomes a kind of accidental community hall—everyone drifts there, a quiet crowd of escapees from the sun.
Compare this with an older, leafier suburb closer to the river. The houses there might lack modern insulation, but the streets are wrapped in green. Big jacarandas lean over footpaths; figs spread their massive limbs across school ovals. On a drone’s thermal camera, these streets show up as cool channels winding through otherwise warm suburbs.
Scientists are now translating observations like this into numbers compelling enough for city planners and politicians to understand. They walk policymakers through maps where colours bloom from blue to red, highlighting where interventions are needed most. Street by street, you can see where a few extra trees, a lighter-coloured road surface, or a redesigned car park could take the edge off a brutal heatwave.
Everyday Life in an Urban Heat Island
For people living inside these heat islands, the science simply confirms what their bodies already know. The extra warmth alters daily routines:
- Early-morning dog walks creep earlier, slipping from 7 a.m. to 5:30 a.m. in search of cooler footpaths.
- Tradies adjust their hours, racing to finish roof work before the metal becomes too hot to handle safely.
- Outdoor sports move under floodlights at night, if they happen at all.
- Elderly residents find themselves trapped indoors, curtains drawn, air-conditioners rattling, electricity meters spinning.
Hospitals feel the effects too. Heat-related illnesses—dehydration, heat stress, exacerbations of existing heart and lung conditions—rise on days when the temperature refuses to fall overnight. Emergency departments in Australia’s hottest suburbs become busier and more strained. Urban heat is not just a comfort issue; it’s a health and equity issue, and one that climate change is quietly amplifying.
Can We Cool a City This Big?
Against this backdrop of rising heat, the scientists mapping these patterns are not just documenting a problem; they’re helping design a response. They talk in the language of “cool corridors,” “green infrastructure,” and “thermal equity.” At its heart, the work is almost disarmingly simple: how do you put shade, breeze, and moisture back into places dominated by concrete and metal?
A growing number of local councils are commissioning urban heat studies before approving new developments. Some are setting shade targets, promising that by a certain year, a certain percentage of streets will be tree-lined. Others are trialling cool roofs—coatings that reflect rather than absorb sunlight—and pale pavements that stay noticeably cooler underfoot.
Community organisations are getting involved too, working with scientists to identify streets most in need of greenery. Schoolkids join tree-planting days, their hands stained dark with soil as they place tiny saplings into the ground, not yet understanding that each slender trunk could eventually protect a child, decades from now, walking home from an exam on a 42-degree day.
Researchers are also exploring how building design can soften heat. Shaded balconies, ventilated facades, green roofs, and inner courtyards that funnel breezes: all of these can gently lower temperatures for the people who live there. In some cities, developers now receive guidelines based on high-resolution heat maps, encouraging them to design with microclimate in mind instead of as an afterthought.
Small Choices, Wide Shadows
From the outside, a tree seems like a modest thing. But when scientists run the numbers, even a single mature tree can have a surprisingly large cooling footprint, lowering the surrounding air temperature and reducing how much heat nearby surfaces absorb. Multiplied across a suburb, these small shadows begin to add up.
This is where personal and policy decisions intersect. The choice to pave a front yard for extra parking instead of planting a tree. The choice to install a light-coloured roof instead of a dark one. The council’s choice to fund street trees in some suburbs but not others. Every decision becomes, in a subtle way, a decision about heat.
Australians are starting to see their cities differently. Not as fixed landscapes, but as systems that can be tuned—warmer or cooler, fairer or harsher—depending on the stories we listen to and the maps we pay attention to. As the science advances, so does our imagination of what a liveable city might look like in a hotter world.
➡️ Why Australian sleep researchers are rethinking blue light guidance for modern households
➡️ Inside the Kimberley where ancient rock art is reshaping Australian heritage protection debates
➡️ Australia’s coastal planners are revising sea wall strategies as storm surges intensify
➡️ What Australia’s bushfire science reveals about the future of smoke exposure in cities
➡️ How Australian marine biologists are tracking coral recovery after repeated bleaching events
➡️ The quiet shift in Australian coffee culture as climate pressures reshape bean supply
➡️ Researchers identify a specific type of adult stem cell with exceptional potential to regenerate human teeth and repair bone
Reading the Heat Beneath Our Feet
Walk through almost any Australian city now and you’ll find hints that this quiet mapping revolution is underway. A weather station on a school rooftop. A group of volunteers walking with clipboards under wide-brimmed hats. A researcher pausing in the middle of a shopping strip to log a sudden jump in temperature near a sunbaked brick wall.
Behind each number collected there’s a moment, a sensation: the feel of hot wind funnelled down a narrow lane, the relief of stepping under a single broad-leafed tree, the oppressive stillness of a sealed car park at noon. The data may live in spreadsheets and maps, but it is rooted in these physical experiences.
In a lab in Adelaide, a young scientist scrolls slowly across a digital map of the city, her cursor skating across colour gradients from blue to orange to red. She zooms in on a zone of deep crimson around a large commercial precinct and sighs. “This is where people are working eight-hour shifts,” she murmurs. “This is a lunch break with nowhere cool to sit.”
Across the country, in Perth, another team uses similar maps to identify where to plant the first trees of a new urban greening plan. They trace future shade across school routes and bus stops, imagining branches that don’t exist yet, leaves that will only rustle in the temperatures of summers to come.
To live in an Australian city in the decades ahead will be to live with heat in ways our parents did not. But it will also mean living with the knowledge that this heat is not inevitable, not uniform, not beyond influence. The invisible patterns are becoming visible.
The scientists walking our streets with sensors and software are, in a sense, cartographers of discomfort. They are drawing maps of where the air burns the lungs a little more, where the footpaths bake bare feet, where the night never quite cools enough to let a child sleep peacefully. Such maps are not meant to scare us for the sake of fear. They are there to guide us—towards trees and lighter pavements, towards shade and water, towards cities that, even in a warming world, can be made more humane.
One day, perhaps, those thermal images from space will show our cities not as blazing islands, but as patches of carefully tended cool woven through the heat. Until then, the work continues street by street, leaf by leaf, degree by degree.
Snapshot of Urban Heat and Cooling Actions
| Aspect | Hotter Conditions | Cooling Opportunities |
|---|---|---|
| Street Environment | Wide roads, dark asphalt, little shade | Street trees, lighter pavements, shaded bus stops |
| Housing Design | Dark roofs, minimal eaves, sealed yards | Cool roofs, verandas, permeable and planted yards |
| Public Spaces | Open car parks, treeless plazas | Shade structures, water features, urban forests |
| Planning Decisions | Low tree targets, car-first layouts | Tree canopy goals, cool corridor networks |
| Community Action | Little engagement with local heat issues | Local planting, shade advocacy, heat awareness |
Frequently Asked Questions
What is an urban heat island?
An urban heat island is an area within a city or town that is significantly warmer than nearby rural or less-developed areas. Hard surfaces like concrete, asphalt, and dark roofs absorb and store heat during the day, then release it slowly at night, keeping urban areas warmer for longer.
Why is urban heat worse in some Australian suburbs than others?
Some suburbs have fewer trees, more paved areas, and more dark-roofed housing, all of which absorb and radiate heat. Planning decisions, housing density, and the amount of green space all influence how hot a suburb becomes, especially during heatwaves. Socioeconomic factors also play a role, as lower-income areas often have less investment in cooling infrastructure and greenery.
How are scientists actually measuring urban heat?
Researchers use a combination of satellite imagery, fixed weather stations, mobile sensors mounted on cars or carried by people, and occasionally drones. They map temperature, humidity, and sometimes wind and surface temperature, then use this data to create detailed heat maps of cities at different times of day and night.
What can be done to reduce urban heat islands?
Key strategies include planting more trees and creating urban forests, installing lighter and more reflective roofs, using cool pavement materials, designing buildings for shade and ventilation, and planning “cool corridors” that provide shaded routes through cities. Changes can be made at household, neighbourhood, and citywide scales.
How does urban heat affect human health?
Urban heat can increase the risk of heat exhaustion and heatstroke, worsen heart and lung conditions, and disrupt sleep when nights stay hot. Vulnerable groups—such as older adults, young children, outdoor workers, and people without access to air-conditioning—are particularly at risk during prolonged hot spells.
Is climate change making urban heat islands worse?
Yes. As average temperatures rise and heatwaves become more frequent and intense, the extra warmth stored in cities compounds the effect. Urban heat islands can turn a hot day into a dangerous one, especially where there is little shade and poor access to cooling.
What can individuals do to help cool their neighbourhood?
People can plant trees and native shrubs, choose light-coloured or reflective roofing when renovating, avoid paving entire yards, support local greening projects, and advocate for shaded public spaces and tree-lined streets. Small actions, repeated across many homes and blocks, can significantly reduce neighbourhood temperatures over time.