The heat wakes you before the sun does. It presses through the curtains, clings to the bedsheets, hums faintly in the walls. In the early grey of a summer morning in Melbourne, or Sydney, or Perth, the city already feels one step ahead of you—radiating, shimmering, quietly simmering. Step outside and the air is heavy, not yet bright, but thick with a warmth that never quite went away in the night. It feels like the city has been holding its breath in warm air all evening, only to exhale it back at dawn.
The City That Never Cools
On paper, the forecast sounds innocent enough: 31 degrees, light winds, clear skies. But the experience at street level tells another story. Stand on a lush, shaded oval in the outer suburbs and the heat feels sharp but fleeting, softened by an occasional breeze threading through gum trees. Now drive twenty minutes closer to the CBD, step out onto a street wrapped in glass, asphalt, and concrete, and the temperature feels like it has tilted a few degrees upward—like someone quietly turned an invisible dial.
This creeping difference is what scientists call the urban heat island effect, and across Australia, it’s no longer a fringe curiosity. It’s a daily, lived reality, measured not just in degrees Celsius, but in sleep lost, hospital admissions, and who gets to feel safe in their own neighbourhood on a 40-degree day.
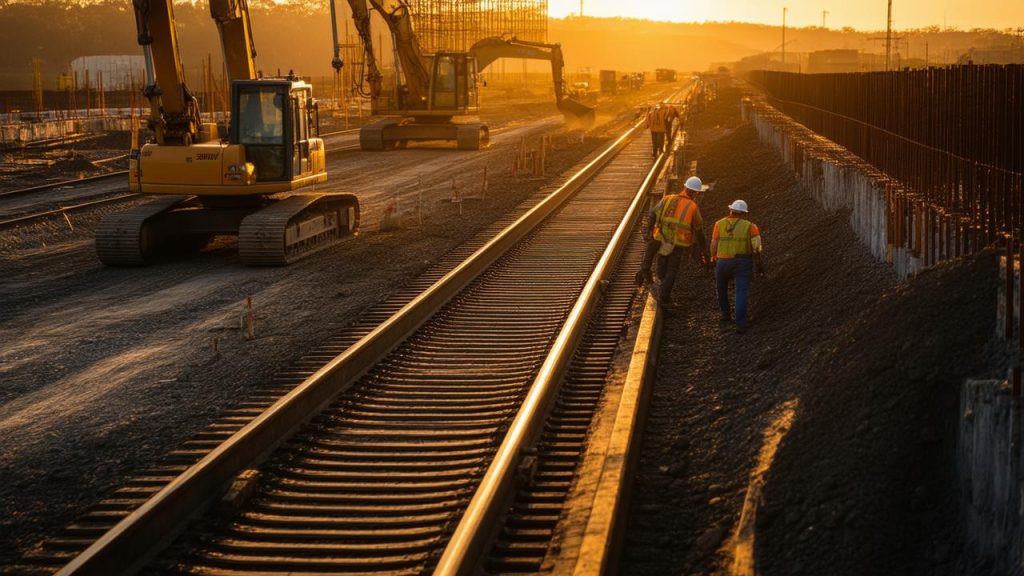
The thing about heat islands is that they don’t roar in like a storm. They arrive by stealth. Roof by roof, road by road, car park by car park, the city becomes a patchwork of heat traps—absorbing sunlight through the day, then bleeding it back into the night. Asphalt softens, bus stops feel like ovens, and tiny pockets of shade become as valuable as air-conditioning.
For decades, Australians have leaned on an easy narrative: we’re a sunburnt country; heat is just part of the deal. But as heatwaves stretch longer, nights stay warmer, and power grids strain under relentless air-conditioners, that old story no longer quite fits. A new one is being written—by satellite images, street-level sensors, and scientists hiking across cities with thermal cameras in hand.
Mapping the Invisible Heat
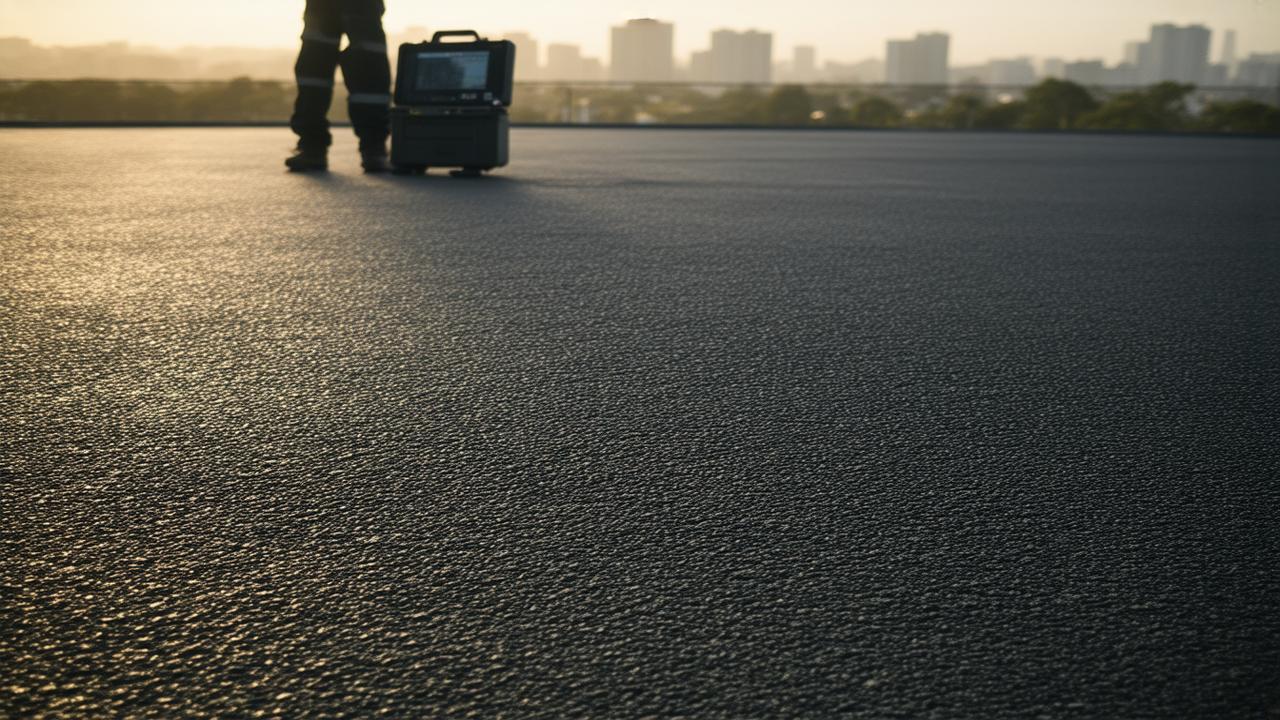
Urban heat isn’t obvious from the driver’s seat of a car with the air-con running. It has to be measured patiently, stitched together from countless data points. That’s exactly what research teams and councils across Australia are doing—quietly building some of the most detailed portraits of urban heat the country has ever seen.
On a summer morning in western Sydney, a team of researchers fans out across a suburb. One scientist cycles along a main road, a compact sensor mounted on the handlebars, recording air temperature and humidity every few seconds. Another walks slow laps around a school perimeter, a thermal camera pointed at the asphalt. Above them, satellites sweep silently overhead, snapping images that show roofs, roads, and open fields glowing at different temperatures like a patchwork quilt seen through heat-sensitive eyes.
The data that returns doesn’t just offer a single number. It reveals patterns—street by street, block by block. A cul-de-sac lined with eucalypts might register several degrees cooler than the next street over, where footpaths run bare under the sun. A new housing estate with dark-tiled roofs and small yards flares white-hot on a thermal map. A wide retail car park, bare except for a few spindly saplings, becomes a black hole of heat, radiating its stored warmth deep into the night.
What surprises many people is how consistently the same areas emerge as hotspots. Outer, fast-growing suburbs, older industrial zones, and low-income neighbourhoods often shoulder the harshest extremes. The language scientists use—heat load, surface temperature, thermal inertia—translates in practical terms to something simpler: who gets to sleep properly at night, and who lies sweating on top of the sheets.
Streets of Fire, Pockets of Shade
Once you’ve seen a thermal map of a city, it’s hard to unsee it. The colours—cool blues and greens for parks and rivers, hot yellows and reds for roofs and roads—tell a story about choices made over decades. Choices about trees, building materials, density, and the value placed on shade.
Walk through Adelaide’s leafy eastern suburbs on a hot afternoon, and you can feel that story underfoot. The air, though warm, curls around large plane trees and mature gums. Front gardens spill shade over cracked footpaths; older, lighter roofs reflect some of the sun’s intensity. Step into a nearby suburb which missed out on that urban canopy, and the difference feels like stepping into a dryer mid-cycle.
To capture this contrast more clearly, researchers often compare land cover with temperature readings. The picture that emerges is stark: where grey surfaces dominate, heat follows; where green seeps in, the extremes soften. That relationship can be sketched simply:
| Street Type | Typical Features | Daytime Heat Profile | Night-Time Heat Profile |
|---|---|---|---|
| High tree canopy street | Large trees, permeable verges, lighter roofs | Noticeably cooler, more shade, softer glare | Cools relatively quickly after sunset |
| Low tree canopy street | Wide asphalt, small trees, dark roofs | Hotter at pedestrian level, strong radiant heat | Stays warm late into the night |
| Commercial strip | Concrete, glass façades, large car parks | Very hot; heat reflected from surfaces | Acts as a heat reservoir for surrounding blocks |
| Park or open green space | Lawns, trees, water features | Cool refuge, often several degrees lower | Cools quickly; can moderate nearby temperatures |
These are not subtle differences. On a brutal summer afternoon, the temperature gap between a treeless street and a park just 500 metres away can be five, six, even eight degrees. For someone with a heart condition, asthma, or limited access to cooling at home, that gap can be the fine line between coping and crisis.
Who Feels the Heat the Most?
In climate-controlled offices, heat can feel like a headline: something you read about, comment on, then skip past. But in many Australian suburbs—especially those spreading quickly westwards and northwards—it feels personal, immediate, and inescapable.
Scientists mapping urban heat overlap their temperature data with something else: census information. When they do, another pattern emerges, just as clearly as a thermal hotspot. Neighbourhoods with lower household incomes, higher rental rates, and older housing stock are often the ones soaking up the most heat. They’re also the areas where people may be least able to afford insulation upgrades, rooftop solar, or the electricity bills that come with constant air-conditioning.
In some outer suburbs, bare new estates are still waiting for street trees to grow tall enough to cast meaningful shade. Backyards have shrunk; fences press close. Children play under harsh sun or stay indoors. Older residents time their errands like desert travellers, venturing out only in the cooler bookends of the day—if those “cooler” hours still meaningfully exist.
Health researchers track a matching rise in heat-related hospital visits during extreme events. People with chronic illnesses, young children, and those who sleep rough or in poor-quality housing are the first to feel the added stress of nights that no longer bring relief. A string of hot nights in a row can be more dangerous than a single scorching afternoon; the body never truly resets before the next onslaught.
Urban heat, then, is not just a technical issue of asphalt and albedo. It’s a social and ethical one. Every degree of trapped warmth reinforces or softens existing inequities. Every patch of planted shade—or lack of it—whispers something about whose comfort and safety were considered when the street was planned.
Designing Cooler Cities, One Choice at a Time
Once you know where the heat lies, the inevitable question follows: what can be done? Across Australia, scientists are teaming up with urban designers, councils, and local communities to turn maps into action plans.
Some of the solutions sound almost disarmingly simple. Plant more trees. Use lighter-coloured materials. Protect and expand parks. But the way they play out at the ground level is anything but trivial. A single mature street tree can shade not only the footpath beneath it, but also cool the air around parked cars and nearby windows. A row of trees can shift the experience of walking along an entire block. A designed “cool corridor”—a connected path of shade and greenery from a train station to a shopping strip—can transform how safe a journey feels on a 40-degree day.
Engineers are experimenting with “cool pavements”—road and footpath surfaces that reflect more sunlight and absorb less heat. Architects talk about green roofs and façades that pull plants up the sides of buildings, turning bare concrete into living insulation. Planners are revisiting old ideas with new urgency: orienting streets for breezes, designing cross-ventilation into homes, and preserving natural waterways, which act as long, meandering air conditioners for the suburbs around them.
None of this is hypothetical. Councils in cities like Melbourne, Brisbane, and Adelaide are already using detailed heat maps to decide where to plant their next thousand trees, where to focus shade structures, where to trial new materials. The invisible data gathered by scientists—temperature readings, thermal images, land cover maps—is seeping into planning documents and budget meetings, slowly reshaping priorities.
➡️ Why Australian sleep researchers are rethinking blue light guidance for modern households
➡️ Inside the Kimberley where ancient rock art is reshaping Australian heritage protection debates
➡️ Australia’s coastal planners are revising sea wall strategies as storm surges intensify
➡️ What Australia’s bushfire science reveals about the future of smoke exposure in cities
➡️ How Australian marine biologists are tracking coral recovery after repeated bleaching events
➡️ The quiet shift in Australian coffee culture as climate pressures reshape bean supply
➡️ Researchers identify a specific type of adult stem cell with exceptional potential to regenerate human teeth and repair bone
At the household scale, the same principles shrink down into everyday decisions: a deciduous tree planted on the western side of a house, light-coloured paint on a roof, shade sails over a driveway that bakes each afternoon. These choices don’t just lower power bills; they ripple into the broader city, one cooler patch at a time.
Listening to the Heat Before It Roars
There is a temptation to think of climate change only in images of catastrophe—bushfires leaping canyons, floodwaters swallowing roads, storms tearing at rooftops. But the rise of urban heat islands across Australia is a quieter kind of warning. It doesn’t arrive as spectacle. It arrives as an extra degree here, two degrees there, a night that doesn’t cool, a park that becomes the only bearable place to sit.
Scientists talk about this as a signal emerging from the noise. Year to year, weather still wobbles. There are mild summers and brutal ones. But the underlying trend is unmistakable: the baseline is creeping up, and cities are amplifying the heat in ways that are both measurable and deeply felt.
If there’s a hopeful thread in this story, it’s that urban heat is not fate. It’s design. It’s policy. It’s habit. Cities are built choices, and they can be rebuilt. The same ingenuity that once turned coastlines and plains into thriving urban centres can now be turned to making them survivable—and even pleasant—under a harsher sun.
Across Australia, as scientists continue to map the silent rise of urban heat islands, they are also handing us a kind of mirror. In it, we can see the cities we have created, glowing hot along their edges and hearts. We can also glimpse the cooler cities we might yet grow—more dappled, more shaded, more forgiving. The question is not whether the heat is rising. It is how quickly we choose to respond, and who we choose to protect first.
Frequently Asked Questions
What is an urban heat island?
An urban heat island is an area within a city or town that is significantly warmer than nearby rural or less built-up areas. This happens because hard surfaces like asphalt, concrete, and dark roofs absorb and store heat during the day, then release it slowly at night, keeping temperatures higher for longer.
Why are Australian cities particularly affected?
Australia already has a hot climate and strong solar radiation. When this natural heat combines with expanding suburbs, dark building materials, and limited tree canopy in many areas, cities can experience intense local warming—especially during heatwaves and prolonged hot periods.
Which areas tend to be the hottest?
Research shows that new outer suburbs with few mature trees, industrial zones, and lower-income neighbourhoods with less green space often experience the highest temperatures. Large car parks, wide roads, and dense built-up areas without shade are common hotspots.
What are the health impacts of urban heat islands?
Urban heat islands can increase the risk of heat stress, dehydration, and serious complications for people with heart, lung, or kidney conditions. Hot nights that don’t cool down properly are particularly dangerous, as the body struggles to recover from daytime heat. Vulnerable groups include older adults, young children, people with chronic illness, and those in poor-quality housing.
How can cities reduce the urban heat island effect?
Key strategies include planting more trees and creating continuous shade, using lighter and more reflective materials for roofs and pavements, expanding and protecting parks and waterways, designing buildings to encourage natural airflow, and targeting the hottest neighbourhoods first based on detailed heat mapping.
What can individuals do at home?
Homeowners and renters can reduce heat by planting shade trees where possible, using light-coloured or reflective roofing and exterior paint, installing shading (like awnings or shade sails), improving insulation, and encouraging local councils to invest in street trees and cool public spaces in their neighbourhood.
Are cities already acting on this research?
Yes. Many Australian councils are now using high-resolution heat maps and satellite data to guide where they plant new trees, build shade structures, upgrade materials, and plan future growth. Scientists continue to work with planners and communities to refine these maps so that cooling efforts reach the places that need them most.